What breaks first when a web app grows from 100 to 10,000 users
Growth tends to fail at fixed limits rather than gradually. Here are four limits a growing product hits, how to spot each one with tools you already have, and why the database connection limit should come first.


The product had its best week ever. Signups up, nothing risky shipped, and then on Tuesday morning the whole thing fell over.
"It was fine, we didn't change anything, and then it stopped."
That is how the story almost always starts, and it sounds like bad luck. It usually isn't.
Something hit a ceiling it was always going to hit.
By the end of this post you will know the four ceilings that break most growing web apps, how to spot each with tools you already pay for, and which to deal with first.
Almost every part of a web stack has an allowance of something: how many open conversations the database will hold, how many jobs your workers finish per minute, how many rows a query can read before it drags. Below the allowance, everything looks healthy. Above it, requests don't get politely slower. They queue, and the queue grows faster than it empties.
That is why growth arrives as an outage rather than a gentle decline, and why the thing that breaks is rarely the thing you have been busy rebuilding. Between a hundred users and ten thousand, four of these ceilings cause most of the pain, and they do not all deserve the same panic.
When the database stops taking calls
You know this one by how it looks. Every page fails at the same instant, including the admin screens you would use to investigate. It heals itself after a few minutes, faster if someone restarts something, then returns at the same busy hour tomorrow.
The cause is just arithmetic. A database will only hold so many conversations at once, and the number comes from how much memory the machine has. AWS publishes the formula on its quota page and works an example through, where an 8 GiB MySQL instance accepts roughly 630 connections. That is the number to hold on to. Not requests per second, not users. About 630 open lines, after which the next caller gets a busy signal.
Now the part that catches people. Every copy of your app keeps a stash of open connections ready to go, called a connection pool. Think of a plumber who keeps fittings in the van rather than driving to the supplier mid-job, reserved whether or not they get used today.
In Python, SQLAlchemy's defaults give each pool 5 connections plus 10 more it can grab when busy, and every worker process wants a pool of its own. So fifteen lines per process, idle or not. You can see where this goes. The sensible response to more traffic is more copies of the app, which is precisely what marches you toward the ceiling.
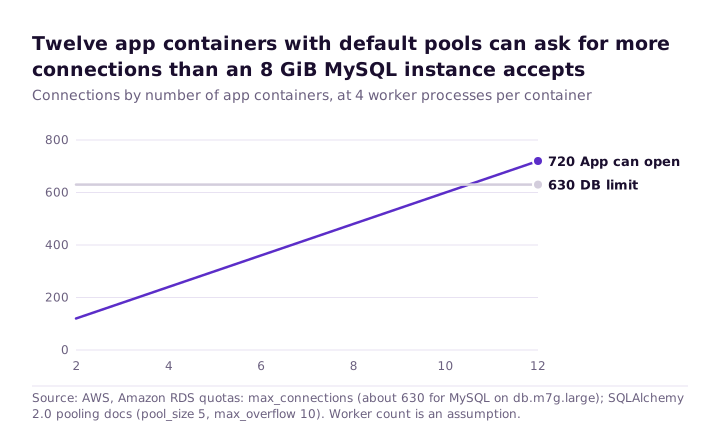
One term to know there is autoscaling, the platform adding copies of your app on its own when traffic rises. Which means finding this particular ceiling is now a robot's job, and it works weekends.
The fix is small. Put a pooler in front of the database: Amazon RDS Proxy, or PgBouncer if you run PostgreSQL. A pooler is a receptionist. Your app processes all call the receptionist, who keeps a modest set of real lines to the database and hands them around as needed. Fifty callers, a dozen lines, nobody notices.
Then do two minutes of multiplication: maximum app copies, times worker processes in each, times pool size plus overflow. If that total beats the database's limit, you don't have a risk, you have an appointment. To see how close you are today, check the DatabaseConnections metric RDS reports to CloudWatch, the AWS dashboard where infrastructure metrics land.
When the site is fast but the work is late
Nobody files an incident for this one. The site feels great. But the welcome email lands forty minutes after signup, the data export has said "processing" since lunch, and support tickets start arriving with the subject "is this working?"
Slow jobs like sending email or building reports go into a queue instead of making the user wait, and separate programs called workers pull them off and do them. It is the kitchen behind the counter, where orders go on the rail, cooks work through the rail.
The trouble is that your users set how fast orders arrive, and you set how fast they get cooked. When orders outpace cooks for an hour, the rail does not clear in an hour. It takes much longer, since the backlog is worked off on top of everything still arriving. Meanwhile the dining room is calm, so nobody suspects a thing.
If you use SQS, Amazon's hosted queue, watch the age of the oldest waiting job rather than how many are waiting. The metric is ApproximateAgeOfOldestMessage. A thousand jobs ten seconds old are fine. Fifty that have sat for an hour mean a real person is staring at a spinner.
Three things to set up, none of them a big project:
- Alarm on age, not on count. Count tells you how busy you are. Age tells you whether somebody is waiting, which is what costs you customers.
- Add workers automatically when the backlog grows. ECS and EC2 Auto Scaling both do this with target tracking on a custom metric, which means "keep this number near where I want it, and add capacity until it is."
- Give urgent work its own queue. A password reset should never be stuck behind somebody's quarterly report. Separate rails, separate cooks. Add a dead-letter queue too, a side bin for jobs that keep failing, so a broken one stops clogging the rail forever.
When one query makes everything feel slow
Everything is a bit sluggish and nobody can describe a pattern. Somebody suggests a bigger database. It helps for two weeks. Then the sluggishness is back, and now the bill is bigger too.
Behind that is usually one query asking a question the database can only answer the slow way, by reading most of a table, row by row. Usually the column it filters on has no index, the lookup table that lets a database jump straight to matching rows. Without one it is reading the whole book to find a page.
Notice what this cost tracks. Not users, but how much data you have stored. So it worsens every month even if your traffic is flat. And because everything shares one database, a single admin dashboard really can make checkout slow for paying customers.
This is the cheapest of the four to fix, once you can see it. In PostgreSQL, turn on pg_stat_statements and sort by total time spent. The top handful of rows usually account for most of the load. In MySQL, the slow query log with the threshold set to one second gives the same list.
Then run EXPLAIN ANALYZE on each one. It makes the database show its working. You are hunting for the words "sequential scan" on a big table, which is the database admitting it read the whole thing.
I would always do this before approving a database upgrade. A bigger instance hides an expensive query instead of removing it, and you keep paying the larger bill every month afterwards.
When shipping gets scary
The fourth limit has no outage at all, which is why it hides so well. First nobody deploys on Friday. Then deploys get rarer in general. A change that takes an hour to write takes a week to release, since nobody wants to be the person who shipped it.
Think about why. With a hundred users, a bad release is something you fix forward in ten minutes and almost nobody saw. With ten thousand, it has a real cost and an email from a customer. The process did not get worse. The consequences did. Any process whose only safety mechanism is being careful will fail once the stakes outgrow what care can cover.
And the data says nervous teams have it backwards. The 2024 DORA report surveyed more than 39,000 software professionals, sorting them into performance groups and measuring what share of each group's changes break in production. The teams that deployed least often had the worst record:
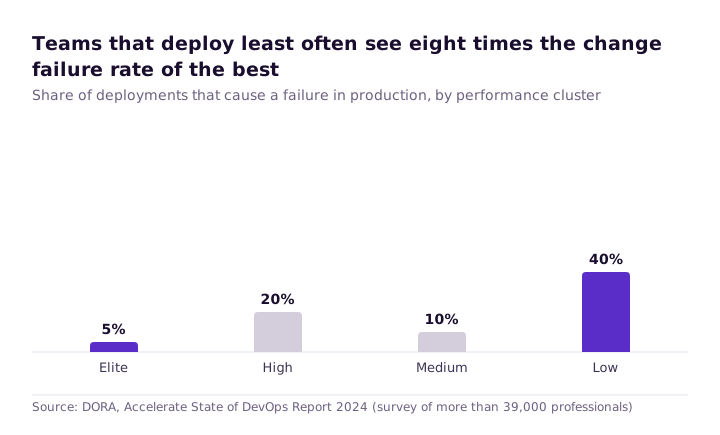
One caveat about the chart is that the middle two groups come out in an odd order, and the report itself discusses why. The two ends are not ambiguous, though. Deploying rarely meant each release carried more changes, so there was more to go wrong and more to search through afterwards.
What actually helps is making a release cheap to undo, with automated checks before anything goes out, a rollback any engineer on call can do without waking a specialist, and showing new code to a small slice of traffic first. On ECS, the deployment circuit breaker rolls a bad deployment back on its own. CodeDeploy blue/green gives you canary releases, where a small share of users get the new version while you watch.
This one is a few weeks of real engineering, which is exactly why you don't want to build it during an incident.
So which do you fix first?
| Limit | What you see | Trigger | Effort to fix | Cost of leaving it |
|---|---|---|---|---|
| Database connections | Whole site down at once, recovers, repeats | More app copies under peak load | Days | Total outage on your busiest day |
| Queue backlog | Site fast, emails and jobs hours late | First real traffic spike | One to two weeks | Quiet churn that never shows as an incident |
| One expensive query | Vague slowness, bigger servers help briefly | Data volume, not users | Hours to find, days to fix | Paying for a larger database indefinitely |
| Release process | Fewer releases, slower changes | Bad releases become customer-visible | Two to four weeks | Everything after it moves slower |
Start with the connection limit, and not because it sounds the most dramatic.
Three of the four just degrade. Emails run late, pages feel slow, releases slow down. Annoying, but the product still works. The connection ceiling is the only one that stops everything for everybody at once, and it fires under peak load, so it picks the hour the business can least afford. It is also the only one that gets closer every time you scale something else correctly, and happily it is the cheapest to fix.
After that, the expensive query. It is quick, and it often cancels an upgrade someone was about to sign off on. Then the queue, then the release path, the biggest piece of work and the one that most rewards being planned rather than rushed.
What you can do this week
Do the multiplication. Ask the database for its real limit with SHOW max_connections; in PostgreSQL, or SHOW VARIABLES LIKE 'max_connections'; in MySQL. Then open CloudWatch and find the highest point DatabaseConnections reached last month.
If your total is over that limit, or the peak is already above 80% of it, put a pooler in front of the database before your next launch. The 80% is not magic, just a comfortable margin, close enough that one busy afternoon could finish the job.
While you are in there, turn on pg_stat_statements or the slow query log. They cost almost nothing, and in a few weeks you will have a ready-made list of your slowest queries waiting when you get to problem three.