Your Kubernetes agent's revert rate is the metric that matters
The architecture for autonomous Kubernetes remediation is settled: the model diagnoses, GitOps acts, RBAC bounds. What nobody can tell you is how often their agent is wrong. Here are the metrics that can embarrass you, and why fixing your resource requests may delete more toil than the agent does.

One of your services asks for more memory than allowed, so Kubernetes kills it.
Your AI agent reads the logs, spots the container hitting its ceiling, and opens a pull request nudging that ceiling up. A human approves.
The alert goes quiet.
Six weeks later the same service dies the same way, now asking for several times the memory it started with. It was a leak all along.
The agent's job had been to make the symptom go away, and it did exactly that.
The uncomfortable part comes next. Nothing in that setup failed.
The permissions were tight, the change went through code review, a human said yes. What failed was the scoreboard.
This post is about the numbers that show whether a remediation agent is any good, and why the one every vendor leads with doesn't show it.
The architecture part is basically settled
Almost everyone has landed on the same design, and it is a good one. The model diagnoses but never acts. The change goes through GitOps, which means your cluster's settings live in a git repository, so changing production means merging a pull request instead of typing a command. The agent's account is scoped so tightly it cannot do much harm, and a gatekeeper in the cluster blocks whatever slips past. You promote it step by step rather than flipping a switch from watching to driving.
If that is what you came for, you can stop reading.
Two details lift this above a consensus of blog posts. First, you can read the permissions yourself. HolmesGPT joined the CNCF Sandbox in October 2025, and its service account can only look. To let it write anything, you have to add that permission yourself, on purpose.
Second, Google. In its writeup of AI in SRE work, a human approves every action its AI Operator takes by default. It only acts alone on minor incidents. The reasoning is worth quoting:
By decoupling the AI's reasoning engine (AI Operator) from the execution engine, we ensure that no matter how rapidly AI models evolve, their ability to mutate production remains strictly governed by deterministic, human-controlled safety boundaries.
In plainer words, the power to change production sits outside the thinking part, so safety stops depending on the model being right. That is the good idea here. The rest of this post is about what it does not solve, which is knowing whether your agent is any good.
Grouping failures by symptom is a trap
Most teams decide what an agent may own by failure type. This one is safe for the agent, that one needs a human. It sounds sensible. It falls apart on contact.
Start with what I could not find. There is no published breakdown of what actually breaks in production Kubernetes clusters. The tidy list of a dozen failure types you see everywhere comes from vendor marketing, and none says how often each one happens. Fine as vocabulary. Useless as a permissions model.
The deeper problem is that a symptom's name is not its cause. Take our out-of-memory kill. At least five different things wear that same badge:
- The limit is too low. The app needs more memory than someone guessed. Raising the ceiling is the right fix.
- The app leaks. Memory use climbs forever. Raising the ceiling buys a few quiet weeks and nothing more.
- A greedy neighbour. Another container on the same machine, with no limits at all, eats the memory. Your well-behaved container is the one that dies.
- A broken health check. Kubernetes pokes the container to ask if it is alive. If that check is wrong, it kills a healthy process over and over.
- Loose accounting. This one surprises people.
That last one is in the Kubernetes documentation in plain sight. Memory limits are enforced reactively, so a container may use more than its limit, and if it does, it may get killed. "May" is doing real work there. The kill lands when the operating system notices it is short, not the instant the limit is crossed. An agent that sees "limit exceeded" next to "container killed" and links them is guessing.
The restart loop is worse, since it is not an error at all. It just means Kubernetes keeps restarting something that keeps dying, waiting longer between tries, topping out at five minutes. The real failure is whatever error the program exited with. Give an agent authority over restart loops and you have handed it a retry pattern, not a problem.
Then there is the word "remediation" itself. It covers reverting one line in one service. It also covers draining a whole machine and evicting everything on it. Group by symptom and those land in the same bucket.
So what do you do instead? Group by how bad it is when you are wrong. How easily can this be undone, and how far does it reach? Sort that way and the permissions almost write themselves.
The metrics that can embarrass you
Every vendor leads with a remediation success rate, and it is the one number to ignore. The agent marks its own homework. It defines the loop it gets scored on: spot the problem, act, confirm the alert cleared. Our leaky service scores perfectly forever while it gets worse.
The useful metrics are the ones that can come back and make you look bad.
- Revert rate. How often a human undoes what the agent did. If nobody measures this, nobody knows whether the agent helps.
- False-action rate. How often it fixed something that was not broken. Algomox calls this the metric that most directly measures the risk the automation itself adds.
- Recurrence rate. How often the same kind of alert returns within a week or two. This is your leak detector, and it was missing from every published metric list I found.
- Escalation precision. How reliably it knows to stop and fetch a human, and how long it flails first.
Algomox also suggests what most crawl-walk-run ladders leave out: a way down. Their bar is 98% precision. If a playbook stops being right that reliably, it loses the privilege of running unsupervised. The exact threshold matters less than having one. Most ladders only climb, which makes them a ratchet.
Google automates the demotion. When its system spots elevated risk or something odd in production, a request that would have run alone gets downgraded to one that needs a human.
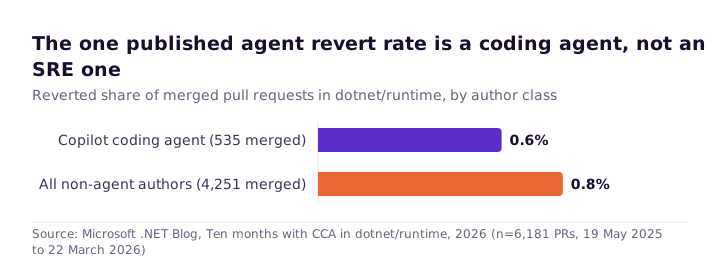
So does anyone publish a revert rate? One company does, and it is not a Kubernetes vendor. Microsoft reported ten months of running its Copilot coding agent in the .NET runtime repository, with the full arithmetic, including the same figures for the humans working beside it.
Where the measured gains show up
Google is big enough to test an SRE practice against a control group. The gains it publishes come from helping humans diagnose, not from letting the agent act.
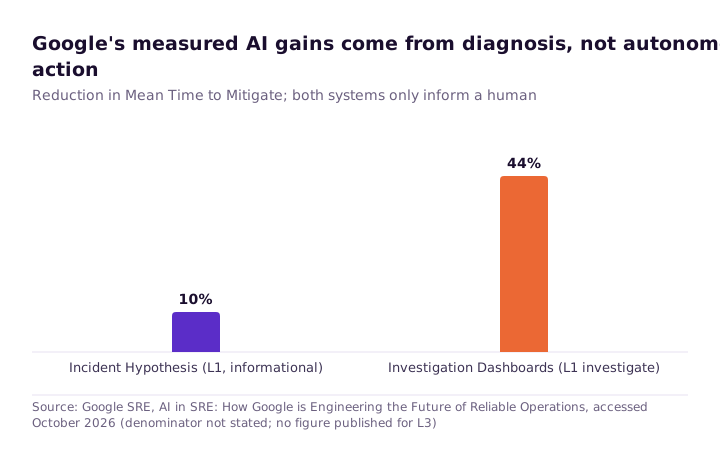
Mean time to mitigate, in that chart, is how long it takes from an incident starting to someone stopping the bleeding.
Meta points the same way. Its root-cause analysis platform runs tens of thousands of automated investigations a day, which sounds like a story about model autonomy until you look at how it works. The analysis comes from roughly 2,000 analyzers, each hand-written by an engineer, then code-reviewed and tested like any other software. The scale comes from human reasoning written down once and run constantly.
Anthropic's own reliability engineer, Alex Palcuie, put it bluntly at QCon London earlier this year:
It would be genuinely hypocritical for me to stand up here and tell you that Claude fixes everything... The fact that my team exists, the fact that we're hiring for many positions, this should show to you that, no, it doesn't work.
You might be solving this one floor too high
Before you evaluate a single agent, check this. A lot of what looks like a hard reliability problem is a boring resourcing problem in a costume.
Cast AI's 2026 State of Kubernetes Optimization Report compared what clusters used against what they were given, across tens of thousands of clusters. They sell rightsizing, so factor that in. But it is direct measurement rather than a survey.
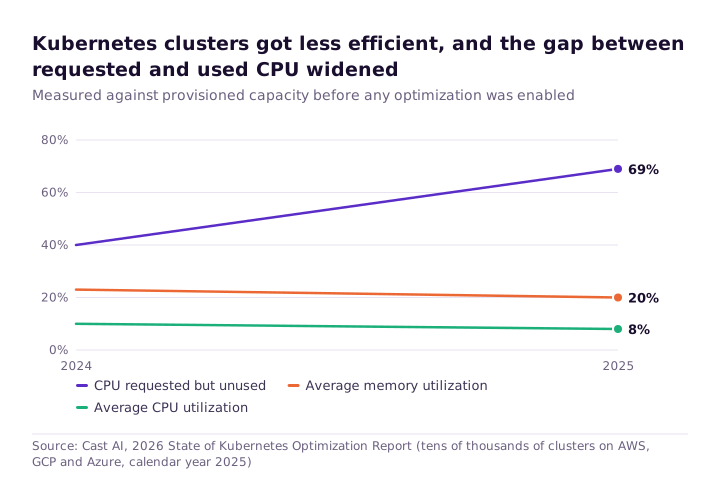
Memory tells the same story. Overprovisioning sat at 79% in 2025, a dry way of saying most reserved memory was never touched. Yet one cluster in the report still took dozens of out-of-memory kills per measurement window despite all that padding, and dropped to near zero once its requests were set from real usage. Generous padding did not save it. Accurate padding did.
The mechanism is not mysterious. It falls like a row of dominoes. Containers with no limits pile onto a machine, the machine runs short of memory, and the operating system kills the lowest-priority ones first. Kubernetes restarts them, they die again, and you have a restart loop. If the pressure holds, the machine is marked unhealthy and everything on it moves elsewhere, landing on the next machine.
Count those up. That is roughly five of the dozen failure types on everybody's list, all from one mistake... somebody guessed how much memory and CPU each service needed. Fixing the guesses clears more of that band than autonomy does, and it ships without an AI model anywhere near it.
ClickHouse ran an experiment that points the same way. Their verdict was that the bottleneck isn't the model's IQ but missing context and weak grounding.
What stays yours
Some calls should not move, however good the tooling gets. Root cause, stated as fact in a postmortem, since that sentence decides what the organisation fixes and what it simply accepts. Severity and containment, since "the model said it was low severity" does not survive a review meeting. And the novel interaction between two systems that never failed together before, which no agent has seen.
Palcuie raised one more worry I would take seriously running an on-call rotation. If the agent handles all the easy incidents, nobody on your team builds the scar tissue that comes from handling them. The strange incident is still yours at three in the morning, with nobody who has practised.
What to do this week
Work out your revert rate and your recurrence rate for whatever automation you already run. Yes, including the scrappy function-and-a-webhook you wrote last year and forgot about. If you cannot pull those two numbers by Friday, build that first. You are not ready to evaluate an agent until you can grade one.
Then take four questions into your next vendor call:
- What is your revert rate, over how many actions?
- What is your false-action rate?
- Which playbooks have been demoted, and what triggered it?
- Was the benchmark run on my incidents, or yours?
None of this is hostile. It is what you would ask of a new hire with production access. An agent you cannot embarrass with a number is an agent you should not give write access to.