How to read a cloud bill that jumped and find out why
A 40% jump rarely has one culprit. How to break the total into places to look, in an order that keeps the product safe.


Someone forwards the AWS invoice with a one-line question: "Why is this so much bigger?"
Nothing launched last quarter. No one did anything obviously silly.
And yet the number is up by about two fifths, which is the kind of jump that gets a meeting booked about it.
The usual first move is to go looking for whoever was careless. I would hold off.
A bill rarely jumps like that because of one person. Usually three things happened at once.
1) The business grew,
2) a few old architecture decisions got more expensive as traffic rose, and
3) nobody was watching the number closely enough to push back.
In this post I'll explain how to turn one big total into a short list of places to look, in an order that saves money early without putting the product at risk. You will also know which problems a tool can find for you, which ones need an engineer to make a decision, and which to do first.
Start with what a tool can find for you
A test environment someone spun up last spring is still running. A database was sized generously the week before a launch and never revisited. Snapshots have been piling up for two years with no rule to delete the old ones. The staging cluster bills happily through every weekend.
That list is the easy money, and you do not need to hunt for it by hand. Every cost tool on the market will find it. So will the free ones already in the AWS console. Cost Explorer shows you where the money goes, and Compute Optimizer points at machines bigger than the work they do.
None of it changes how the product behaves. Someone just has to turn it off.
Containers deserve their own look, since their waste hides unusually well. Datadog went through its customers' AWS bills for its State of Cloud Costs report. Most of what those companies paid for container capacity was never used by anything:
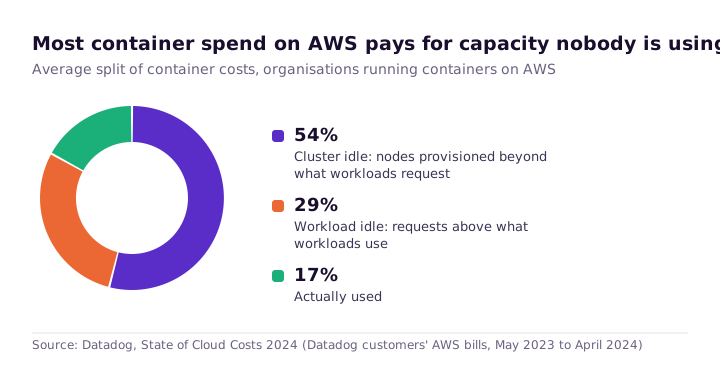
Think of it like catering. You book a room for a big wedding, a fraction of the guests turn up, and the ones who do barely touch their plates. You still pay for every seat and every meal. The chart splits that waste into two kinds, and they have different owners. The size of the room is a platform decision. How much each team asked for on its plate is the team's.
Seventeen percent actually used is an average, so your own figure will differ. Some empty space is sensible headroom too, since a cluster with no slack falls over the moment traffic spikes. Still, if nobody has ever checked those numbers against real usage, that is where your first month of savings is sitting.
The same report turns up two more jobs with no downside. A lot of companies are still running older-generation EC2 machines, meaning AWS's previous hardware models. The newer equivalents are usually faster for the same money, or cheaper. Most of the average storage bill also still goes on gp2 disks, the older general-purpose type. The newer gp3 is cheaper, and you can switch a disk over without taking anything offline.
Neither of those needs an architect. Both need one person with a free afternoon and permission.
Then look at the shape of the system
Picture a service in one data centre reading its database in another, a few miles away. Both machines are the right size. Both look busy. Neither is wasteful on its own, and no tool will flag either of them. But every single read crosses a boundary that AWS charges for, all day, forever.
That is the second kind of waste. It is not in any one resource, it is in how the parts are arranged, which is why a cost report can't see it. Four patterns come up again and again.
Data crossing boundaries. AWS divides each region into availability zones, which are separate data centres close together, and charges you for traffic that moves between them. It charges more between regions, and more again for data leaving AWS entirely. In Datadog's data, 98% of organisations were paying zone-to-zone charges, and that one line was almost as large as every other kind of data transfer put together. It is the toll booth nobody remembers installing.
Always-on capacity for occasional work. A nightly report, or a month-end batch job, running on machines that stay up around the clock. The machine is the right size for the job. It just sits awake for the twenty-two hours a day it has nothing to do.
One expensive query. Most systems have exactly one. A missing index, a job that reads an entire table to find a single row, or a lookup inside a loop that could have been done once. It never appears as its own line on the bill. It appears as a database that is always busy, and the reflex for a busy database is to buy a bigger one.
Commitments that don't match what you run. Savings Plans and Reserved Instances are AWS's biggest discount. You promise to spend a certain amount for a year or longer, and pay less per hour. It is a gym membership. Cheaper than paying per visit, as long as you actually go. Most eligible companies have one, but very few cover much of their bill with it:
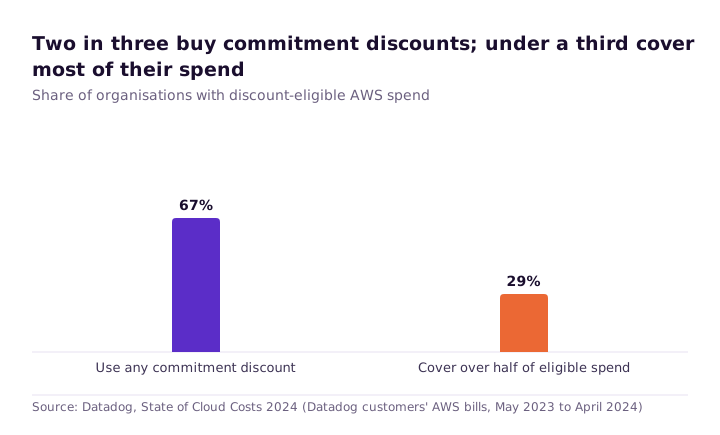
So what do you do about these four? Each one needs a human to make a call. Moving a service to end that zone-to-zone toll means scheduling a migration window. Making a batch job start on demand means accepting a cold start, the delay while a machine wakes up before the work begins. And a commitment is a bet on what you will still be running next year, so finance belongs in that conversation.
The order matters more than the list
| Where to look | Who finds it | Risk to the product | Time |
|---|---|---|---|
| Unused resources, oversized instances, old snapshots, non-production running overnight | A tool | None | Days |
| Previous-generation instances, gp2 volumes | A tool | Low | Days |
| Over-provisioned container clusters and requests | A tool, then the platform team | Low, if you keep headroom | Days to weeks |
| Cross-zone and cross-region traffic | An architect | Medium: a planned move | Weeks |
| Always-on capacity for occasional work | An architect | Medium: a design change | Weeks |
| One query or job driving the database bill | An architect | Low once found | Days to find, weeks to fix |
| Commitment coverage | An architect and finance | None, but it has a term | Days to model |
Do the first three rows before you touch anything else. They are the easy ones, but that is not the real reason.
The real reason is political. A visible drop in the first month, with nothing broken and no customer noticing, changes how the whole company talks about this. Most teams have never once watched the bill go down. Once they have, getting engineering time for a migration stops being an argument.
Reversing the order is how teams end up halfway through a rebuild with the roadmap on hold, still chasing a number nobody has broken down yet.
Nobody owns the number
Ask who is responsible for the cloud bill. You will usually get a pause, then the name of whoever forwards it. That is the actual reason a 40% rise lands as a surprise. The invoice arrives as one total for the entire company. It never says which product, team or customer caused what. So when it grows, there is no honest answer to "what drove that".
If that sounds familiar, you have plenty of company. Flexera's 2025 survey asked technology leaders to name their biggest cloud challenge, and 84% of them said managing spend. Not security, not migration. The bill.
The fix is mostly discipline, and it is two things.
- Make the bill readable. Tag every resource with the team, product and environment that owns it. Then switch those tags on for cost allocation, which turns them into columns you can slice the bill by. Enforce the rule going forward with a tag policy that refuses untagged resources. Don't try to tidy the entire past first, since you will never finish it.
- Put a name on it. One person owns the monthly number, with an AWS Budgets alert set at a threshold that means someone actually goes and looks.
Do those two and the next jump gets noticed while it is still small, back when it is a cheap conversation rather than a meeting.
What to do this week
Open last quarter's bill and ask one question out loud: can anyone here say which product or team caused the increase? If the answer is no, start there, with a tagging rule and one name against the number.
Then take the boring tool-findable list. Turn off what nobody is using, and write down what you removed, since in three months someone will ask. The structural work can wait until you can actually see what you are looking at.